econetplatform.com

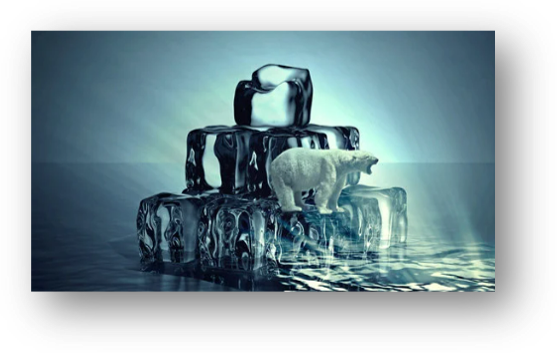
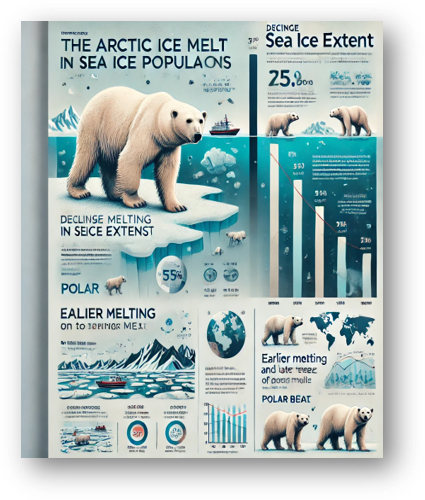
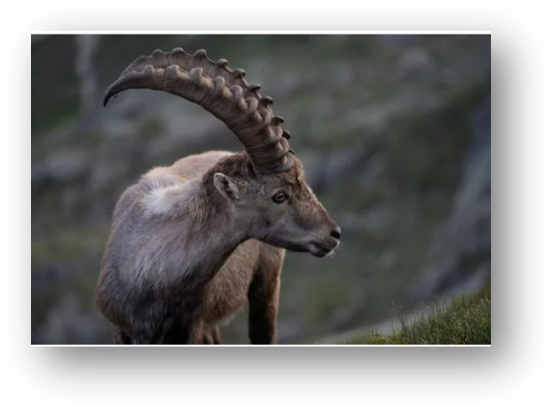
Climate Change and Biodiversity

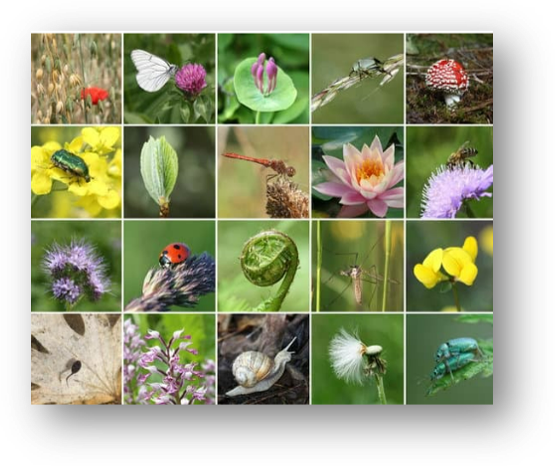
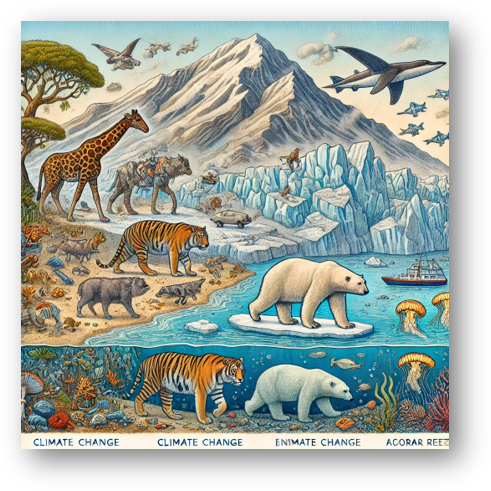
Climate change affects biodiversity by altering habitats, disrupting food chains, and endangering species.
This section introduces how climate-driven changes influence animal and plant life worldwide.

Altering Habitats

  • As temperatures rise, certain species must move to cooler regions or higher altitudes to survive. For instance, plants and animals in mountainous areas often migrate upward, while others move toward the poles.
  • Many plant species now experience earlier flowering or fruiting due to warmer springs, affecting the animals that rely on them for food.
  • Melting ice in the Arctic and Antarctic threatens species like polar bears and penguins that depend on ice habitats for hunting and breeding. Similarly, coral reefs suffer from ocean warming, leading to coral bleaching and habitat loss for marine life.
  • This visual shows how climate change alters habitats, depicting effects like species migrating to higher elevations, melting polar ice affecting polar bears, and coral bleaching.

                        Understanding Habitat Shifts

  • Many species move to cooler or higher areas as temperatures rise to survive. These ‘habitat shifts’ impact the survival of animals and plants, forcing them to adapt to new conditions or face extinction.

                      Coral Reefs and Marine Biodiversity

  • Warmer oceans lead to coral bleaching, where corals and life-supporting algae lose colour. This threatens marine species dependent on coral reefs for shelter and food, reducing biodiversity in these areas.

          Endangered SpecIes and Climate Change

  • Animals like polar bears, penguins, and snow leopards face shrinking habitats due to climate change. As conditions change, species without adaptable traits are at risk of becoming endangered or extinct.

                 Climate Impact on Plant SpecIes

  • Plants face challenges from shifting seasons, droughts, and extreme weather. Some plants, like alpine flowers, are highly vulnerable to these changes because they rely on specific temperature and moisture levels.

                Polar Bears and Arctic Ice Melt

  • Polar bears depend on sea ice to hunt seals. As the Arctic ice melts, they struggle to find food, which affects their survival.

Dependence on Sea Ice for Hunting

  • Polar bears primarily hunt seals, which they catch by waiting at holes in the sea ice where seals come up to breathe. The ice provides a stable platform for hunting and is critical to their diet.
  • As the Arctic warms, sea ice melts earlier in the season and freezes later in the year, reducing the time polar bears have access to their hunting grounds. This limits their ability to hunt seals and, therefore, their access to food.

Challenges In Finding Food

  • With less time on the ice, polar bears often have to fast for longer periods. This can lead to malnutrition and affect their health, particularly for young cubs who rely on their mothers’ milk and protection.
  • In some areas, polar bears are forced to swim long distances to reach the remaining ice, which uses up valuable energy reserves. Many bears can’t sustain the increased energy demands, leading to a higher risk of starvation.

Impact on Polar Bear Populations

  • Malnutrition and energy deficits make it harder for polar bears to successfully raise cubs, leading to lower reproduction rates. Female bears need significant fat reserves to support pregnancy and nursing.
  • Studies have shown that polar bear populations in some regions are already declining due to these environmental stresses. If current trends continue, polar bears may face severe population reductions or even local extinction.

Effects on Migratory Birds

  • Migratory birds rely on seasonal cues to migrate. Climate change disrupts these cues, affecting breeding and food availability along migration routes, making survival difficult for these species.

Broader Ecological Impact

  • Polar bears are considered an apex predator in the Arctic ecosystem. Their decline impacts the balance of this ecosystem, affecting species dynamics and potentially altering prey populations.
  • Polar bears serve as a visible indicator of the health of the Arctic. Their struggle to survive reflects the broader impact of climate change on the Arctic ecosystem and highlights the urgent need to address global warming.

Impact on Forest Ecosystems

  • Forests, home to diverse wildlife, are under threat from rising temperatures, fires, and deforestation. Climate change intensifies these risks, affecting the many species that depend on forest habitats.

              Mountain and Alpine Species Adaptations

  • Species in mountainous regions adapt to cold climates and specific altitudes. As temperatures rise, these species must move higher up to find suitable conditions, leading to population declines in lower habitats.

Adaptations to Cold Climates and High Altitudes

  • Many species in mountainous areas, such as snow leopards, alpine plants, and certain bird species, have evolved to survive in colder, high-altitude climates. They often have adaptations like thick fur, short growing seasons, and specialized diets that suit the unique conditions of mountain ecosystems.
  • These species typically occupy a specific altitude range with optimal temperatures, vegetation, and prey availability. They are highly adapted to these narrow ranges, which means they struggle to survive if conditions change significantly.

The Effect of Rising Temperatures

  • As global temperatures increase, the temperature bands suitable for these cold-adapted species also move higher up the mountain. To maintain the conditions they need, species must shift to higher altitudes where it remains cool enough for their survival.
  • Mountains have a finite altitude, so as species move higher, they eventually run out of suitable habitat. This phenomenon, known as “mountaintop extinction,” occurs when species reach the top of the mountain and have nowhere else to go, leading to local population declines or extinction.

Population Declines in Lower Habitats

  • As species move upward, lower habitats become less biodiverse. The loss of these species can disrupt local ecosystems, affecting everything from soil health to predator-prey dynamics.
  • When multiple species are forced into higher altitudes, competition for limited resources (such as food, space, and nesting areas) intensifies. Some species may be outcompeted and pushed to the brink of survival.
  • Not only do animal species move, but plant species in mountainous regions also migrate upward to find cooler conditions. This shift changes the composition of plant communities, which can impact herbivores and pollinators that rely on specific plants for food and shelter.

Freshwater Ecosystems and Fish Populations

  • Rising temperatures and water scarcity stress freshwater ecosystems. Fish and amphibians are especially vulnerable, facing habitat loss as rivers and lakes dry up or warm.

Invasive Species and Competition

  • Climate change allows invasive species to expand into new regions, where they compete with native species for resources, disrupting local ecosystems and biodiversity.

Pollinators Under Threat

  • Pollinators like bees and butterflies are essential for plant reproduction. Climate change affects their life cycles and food sources, threatening the plants they pollinate and the ecosystems that depend on them.

BIodiversity Loss and Its Consequences

  • Biodiversity loss reduces ecosystem resilience, impacting food security, water quality, and carbon storage. This slide explores why preserving species diversity is crucial for a balanced environment.

Conservation Efforts and Solutions

  • Efforts to protect biodiversity include creating protected areas, restoring habitats, and reducing carbon emissions. Conservation helps species adapt to changing climates and maintain ecosystem health.

Understanding Data Visualizations in Climate Change

Conclusion and Takeaway

  • Climate change poses a major threat to global biodiversity. Understanding its impact on species and ecosystems emphasizes the need for conservation and climate action. Protecting nature starts with informed, committed actions.

Visualizing Climate Impact

  • Climate change data is collected from various sources such as satellite observations, weather stations, ocean buoys, and ice cores. This data includes temperature records, carbon emissions, sea levels, and extreme weather events, helping scientists understand long-term climate patterns and changes.

Ocean Buoy

Ice Cores

Why Visualize Climate Data?

  • Data visualization makes complex climate data accessible, engaging, and easier to understand for scientists, policymakers, and the public. It helps communicate trends, patterns, and relationships that may otherwise be difficult to interpret.

Types of Climate Data

  • Key types of climate data include atmospheric CO₂ levels, sea surface temperatures, ice sheet measurements, and data on extreme weather events. Each data type provides insights into different aspects of climate change


  • This visual represents the key types of climate data, including atmospheric CO₂ levels, sea surface temperatures, ice sheet measurements, and data on extreme weather events.

Data Visualization

  • Data visualization represents information graphically, such as through charts or maps, making it easier to comprehend large data sets. In climate science, visualizations make complex climate data accessible for analysis and public understanding.

Benefits of Data Visualization in Climate Science

  • Climate data visualization aids in recognizing trends, informing policy decisions, and fostering public awareness. It transforms numbers and complex data into intuitive visuals that support evidence-based decision-making.

Common Visualization Techniques for Climate Data

  • Common techniques include line graphs for trends, bar charts for comparisons, heat maps for temperature distribution, and time-series visualizations to show long-term changes in climate data.

                        Line Graphs in Climate Data

  • Line graphs show trends over time, such as the rise in global temperatures. They help in tracking gradual changes and identifying potential causes and effects in climate data.

                      Bar Charts for Emission Data

  • Bar charts are useful for comparing carbon emissions across countries or sectors. They display categorical data, making it easy to see which areas contribute most to emissions.

Heat Maps to Show Temperature Variations

  • Heat maps use color to represent data intensity. In climate data, they show temperature differences across regions, providing a visual representation of warming or cooling trends globally.

Time-Series Visualizations

  • Time-series visualizations display data points over time. They are essential in climate science to show trends over decades or centuries, helping illustrate long-term impacts of climate change.

                    Interactive Climate Visualizations

  • Interactive visualizations, like climate dashboards, allow users to explore data in detail, making it easier for people to engage with and understand complex climate data on their own terms.

Case Study: NASA Climate Change Data Portal

  • NASA’s Climate Change Data Portal is an example of using visualizations to provide accessible climate information. It includes charts, maps, and interactive tools that make climate data available to the public.

The Role of Color in Climate Data Visualizations

  • Color in visualizations, such as red for warming and blue for cooling, enhances the clarity of data. Color choices help viewers quickly interpret trends and patterns in climate data.

                  Interpreting Temperature Anomalies

  • Temperature anomaly charts show deviations from a baseline average, indicating whether an area is warmer or cooler than usual. These anomalies highlight climate change impacts over time.

                Visualizing CO₂ Levels Over Time

  • CO₂ level charts, like the Keeling Curve, show the historical rise in atmospheric CO₂, a key driver of global warming. These visualizations make the upward trend in emissions clear to viewers.

              Sea Level Rise Visualizations

  • Sea level rise charts and maps show areas vulnerable to flooding due to rising seas. These visuals highlight the risks to coastal cities and emphasize the urgency of climate action.

              Ice Sheet and Glacier Melt Visualizations

  • Visualizations of ice sheet and glacier melt, often through time-lapse imagery, illustrate the visible impacts of warming. These visuals make the loss of ice more comprehensible and impactful.

Extreme Weather Event Trends

  • Trends in extreme weather events, visualized through bar charts or frequency maps, show the increase in events like hurricanes and wildfires, linked to climate change.

            Mapping Climate Vulnerability

  • Vulnerability maps show regions and populations most at risk from climate impacts, often highlighting areas with limited resources or infrastructure to cope with climate-related threats.

Building Skills in Data Interpretation

  • By analyzing climate data visualizations, students develop critical thinking and data literacy skills, enabling them to interpret information and form evidence-based opinions.

How You Can Create Climate Data Visualizations

  • Students can use tools like Google Data Studio, Tableau, or Excel to create their own visualizations. This hands-on experience helps them understand the power of visual data communication.

Conclusion and Call to Action

  • Understanding climate data visualizations empowers students to engage with climate issues. They can use this knowledge to advocate for climate action, communicate effectively, and drive change.
Skip to content